The Lethal Phenotypes Portal is a curated online
resource containing a catalogue of genes associated to lethal phenotypes
in humans. More detailed information regarding the contents of this
resource and the methods that were used to collate the information
presented here can be found in the 'Database
Content' and 'Data Curation' tabs.
Gene summary
Gene based search to display a summary of the information
contained on the catalogue.
Type the gene symbol in the Search Gene box.
For more detailed information and access to the entire
catalogue, go to the 'OMIM Catalogue' tab.
Search Gene
The content of this catalogue is intended for use by researchers and
geneticists and should not be relied upon for clinical or medical decisions.
Neither the site contributors nor the site hosts accept any responsibility
for any loss or damage resulting from reliance on the information provided.
Developed by Queen Mary University of London.
Disclaimer -
Queen Mary University of London
Content updated 11.01.2024. For more information please contact us at
https://whri-phenogenomics.github.io/
Content of the database
Data Curation
Contains a brief description of the methods used in the data curation
process when creating this app. These include the search terms used as
part of the OMIM query strategy and subsequent manual curation to
identify genes associated to lethal phenotypes in humans, the criteria
used to assign genes to different lethality categories, and summary
information on the resulting dataset.
Data in tabular format available for download that displays information
on all the gene-disease pairs curated from OMIM records, whether they
were identifed as lethal hits through our queries or not, the source of
evidence (proband versus affected family members), and gene summary
information on the presence of lethal phenotypes and the earliest age of
death recorded. HPO age of death categories and definitions are also
listed here.
Mouse evidence on lethality/viability for those genes with a
one-to-one human ortholog included in the catalogue. Information
on lethality from mouse knockout lines as collected by the
Mouse Genome Informatics Database (MGI) and the International
Mouse Phenotyping Consortium (IMPC, DR 20.1). Human cell
proliferation scores from the 'Gene Effect Score' tab are also
included to compare essentiality at the cellular level.
Displays the distribution of gnomAD v4.0 loss-of-function (LoF)
observed/expected upper bound fraction (LOEUF) scores.Lower LOEUF
values indicate a higher probability of being intolerant to
heterozygous LoF variation. A threshold of 0.35 is suggested by
the authors.
Displays the distribution of RGC-ME mean Shet scores,
a selection coefficient on relative fitness loss due
to heterozygous pLOF variation. A suggested shet cutoff
> 0.075 can be used to identify highly constrained genes.
Displays the distribution of mean DepMap 23Q4 CRISPR Gene Effect score
which were derived from cancer cell lines as part of the Broad
Institute's Dependency Map. Lower Gene Effect scores indicate
higher essentiality at the cellular level. A threshold of -0.5 was
used to categorise genes as 'Cellular Essential' (<-0.5).
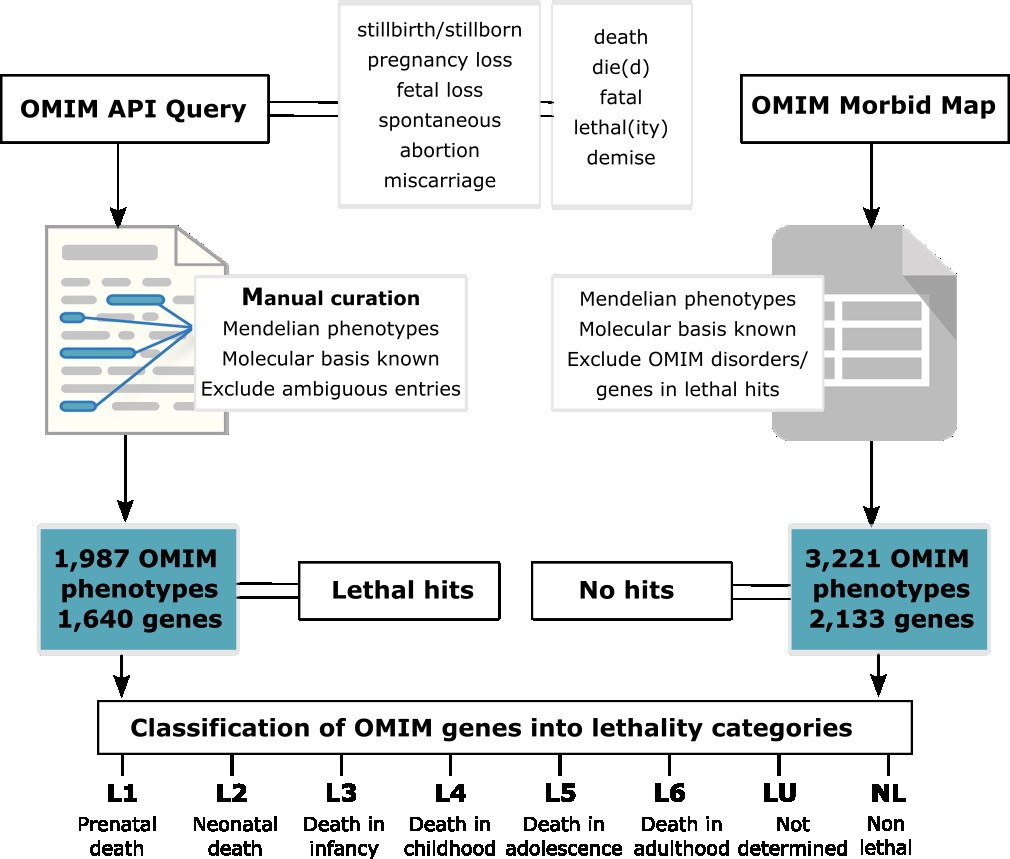
OMIM clinical records were data mined using a series of API queries
of terms linked to lethality. The complete list of terms
is illustrated in the Figure. Manual curation of all the hits
was performed and ambiguous reports of lethality were discarded. Each
unique disease-gene association was assigned to a ‘lethality category’
based on the earliest age of death reported, with categories grouped by
age ranges defined by the HPO age of death terms described in the
OMIM Catalogue tab.
Following the manual curation process and exclusion of ambiguous
entries from OMIM, 57% (2,133/3,773) of genes associated with a
subset of OMIM disorders: single-gene,with strict Mendelian phenotypes
and molecular basis known were not captured by the queries. This
indicates a lack of clinical records pertaining to lethality. Moreover,
33% (1,239/3,773) are exclusively linked to disorders that have
documented lethal phenotypes. The remaining 11% (401/3,773) are
associated with both lethal and non-lethal phenotypes. In terms of
lethality categories, 975 genes (59% of all lethal genes, 26% of
all disease genes catalogued), have records of prenatal,
neonatal or infant death (classified as pre-infant-lethal) as opposed to
post-infant-lethal genes, where the earliest reported age of death
spans from childhood to adulthood.
*Non lethal means no records of early death in OMIM OR
not captured by our OMIM API queries.
Catalogue of lethal phenotypes in humans curated from OMIM
This catalogue of genes was curated from OMIM, identifying reports
of lethality through different fields including 'Description',
'Clinical Synopsis' and 'Clinical Features'. The entire
list of search terms can be found in the 'Data Curation' tab.
We have included all disorders with specific mention to a
lethal phenotype and assigned each gene-disorder to one of seven
lethality categories according to the earliest age at which
death occured according to OMIM records. The age brackets for
these categories are based on definitions provided by
Human Phenotype Ontology (HPO) terms.
The details for these categories are listed below:
Lethality categories according to HPO:
L1: Prenatal death (HP:0034241); Death before birth
L1.1: Miscariage (HP:0005268); Spontaneous loss of a fetus
before the 22th week of pregnancy
L1.2: Stillbirth (HP:0003826); Death of the fetus in utero
after at least 22 weeks of gestation
L2: Neonatal death (HP:0003811); Death within the
first 28 days of life
L3: Death in infancy (HP:0001522); Death within the
first 24 months of life
L4: Death in childhood (HP:0003819); Death during childhood,
defined here as between the ages of 2 and 10 years
L5: Death in adolescence (HP:0011421); Death during adolescence,
the period between childhood and adulthood (roughly between
the ages of 10 and 19 years)
L6: Death in adulthood (HP:0033763); Cessation of life at
the age of 16 years or later
LU: Age of death undetermined
For multiple search terms, use '|' between the words, e.g. syndrome|demise
Mouse Evidence for Pre-infant lethal genes
Mouse viability data was obtained from two
different sources of evidence: 1) Primary viability screen
performed on knockout lines by the International Mouse
Phenotyping Consortium (IMPC), and 2) Evidence of
lethal phenotypes in knockout mouse as collected from the
literature in the Mouse Genomes Informatics
(MGI) resource.
Mouse Evidence for OMIM Catalogue genes
MGI
IMPC
LOEUF Comparisons
The histograms and violin plots show the distribution of gnomAD's
loss-of-function (LoF) observed/expected upper bound fraction (LOEUF) scores.
Lower LOEUF values indicate a higher probability of being intolerant to heterozygous
LoF variation. A threshold LOEUF < 0.35 is suggested by the authors to identify constrained genes.
The dropdown menu allows the selection of different lethality categories and modes
of inheritance for comparison.
Shet Comparisons
The histograms and violin plots show the distribution of RGC-ME mean Shet score, a selection coefficient on relative fitness loss due to heterozygous pLOF variation.
A suggested shet cutoff shet > 0.075 can be used to identify highly constrained genes.
The dropdown menu allows the selection of different lethality categories and modes
of inheritance for comparison.
DepMap Comparisons
Displays the distribution of mean Gene Effect scores
which were derived from cancer cell lines as part of the Broad
Institute's Dependency Map. Lower Gene Effect scores indicate
higher essentiality at the cellular level. A threshold of -0.5 was
used to categorise genes as 'Cellular Essential' (<-0.5). The dropdown menu
allows the selection of different lethality categories and modes of
inheritance for comparison.